40 roofing statistics for 2026
 By Roof Replacement Cost Estimator research team · Published · Updated
Source: ARMA quarterly summaries, 2018–2026. Shingles include individual shingles; shipments cover new roofs and reroofing.
Key takeaways
- The 2023 American Housing Survey put median US homeowner roofing-project expenditure at $10,000 for its two-year improvement window, rounded to the nearest $100. (US Census Bureau / HUD, October 2024)
- Verisk reported a mean US residential roof-replacement cost of $17,631 in its 2025 insurance-based roof data. (Verisk, May 2026)
- US asphalt-shingle shipments in the first half of 2026 fell 4.7% from the same period of 2025 in ARMA’s published year-to-date comparison. (ARMA, July 2026)
- The median annual wage for US roofer employees was $55,440 in May 2025. (Bureau of Labor Statistics, September 2026)
- Verisk’s 2025 aerial-imagery analysis classified 38% of US residential roofs as being in moderate to poor condition. (Verisk, May 2026)
- IBHS reports that sealing roof-deck seams can reduce water intrusion after roof-cover loss by up to 95% in its testing. (IBHS, accessed October 2026)
Compare roof-project costs, material demand, labor, resilience and waste using named primary sources.
Explore the roofing shipment data
Every quarter from 2018 Q1 to 2026 Q2, across all four categories in ARMA’s public summaries. Select a series, search a year and sort a column.
One square is 100 ft² of product area. US built-up roofing excludes saturated felts. Changes below are calculated from the selected quarterly records; ARMA’s published year-to-date totals can include revisions.
136 records. JavaScript narrows the table to your selected series.
| Series | |||
|---|---|---|---|
| 2026 Q2 | Canada asphalt shingles | 2,570,469 | -20.79% |
| 2026 Q2 | US modified bitumen | 12,497,481 | +11.37% |
| 2026 Q2 | US built-up roofing sheets | 940,158 | -15.63% |
| 2026 Q2 | US asphalt shingles | 44,838,320 | +0.21% |
| 2026 Q1 | Canada asphalt shingles | 3,190,632 | -13.41% |
| 2026 Q1 | US modified bitumen | 9,053,052 | -13.75% |
| 2026 Q1 | US built-up roofing sheets | 834,560 | -16.68% |
| 2026 Q1 | US asphalt shingles | 38,129,741 | -9.86% |
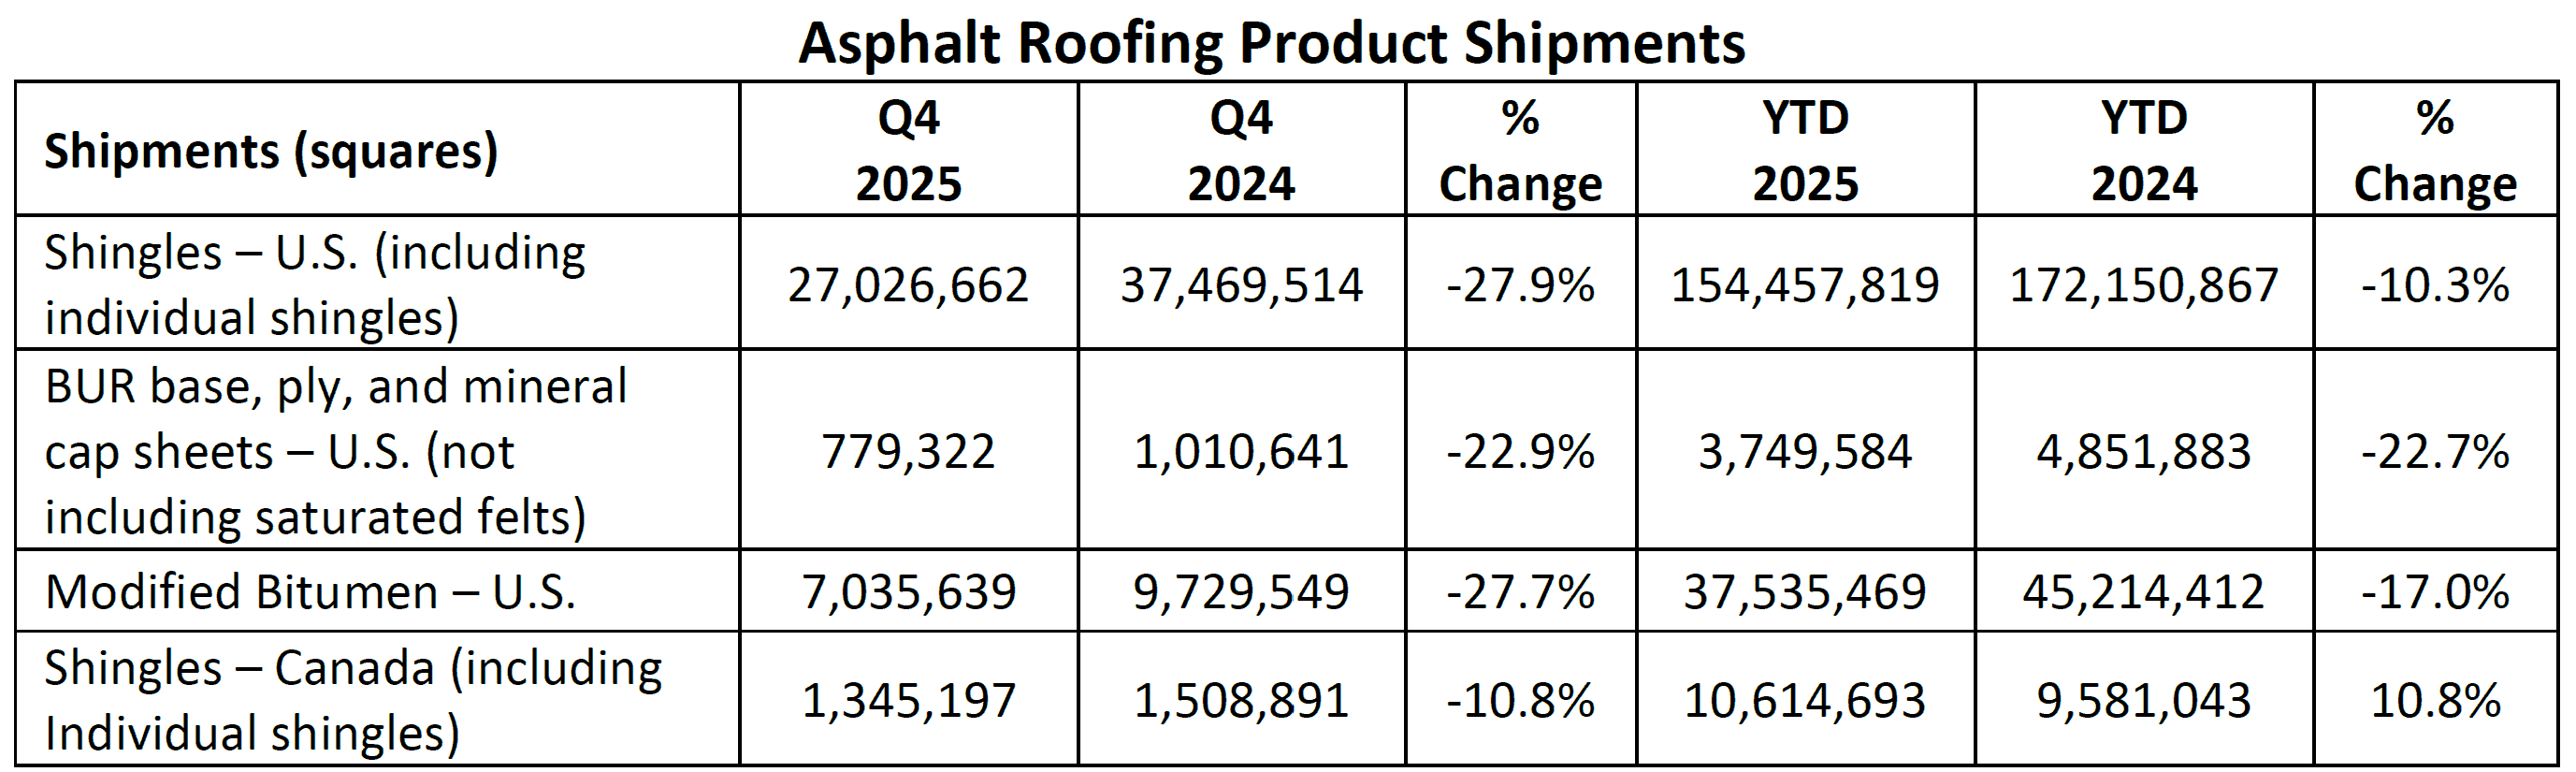
| 2025 Q4 | Canada asphalt shingles | 1,345,197 | -10.85% |
| 2025 Q4 | US modified bitumen | 7,035,639 | -27.69% |
| 2025 Q4 | US built-up roofing sheets | 779,322 | -22.89% |
| 2025 Q4 | US asphalt shingles | 27,026,662 | -27.87% |
| 2025 Q3 | Canada asphalt shingles | 2,243,380 | -6.15% |
| 2025 Q3 | US modified bitumen | 8,731,586 | -27.13% |
| 2025 Q3 | US built-up roofing sheets | 854,240 | -32.94% |
| 2025 Q3 | US asphalt shingles | 40,387,814 | -10.04% |
| 2025 Q2 | Canada asphalt shingles | 3,245,046 | +6.15% |
| 2025 Q2 | US modified bitumen | 11,221,675 | -12.24% |
| 2025 Q2 | US built-up roofing sheets | 1,114,346 | -21.18% |
| 2025 Q2 | US asphalt shingles | 44,743,390 | -4.32% |
| 2025 Q1 | Canada asphalt shingles | 3,684,758 | +49.52% |
| 2025 Q1 | US modified bitumen | 10,496,593 | -2.05% |
| 2025 Q1 | US built-up roofing sheets | 1,001,676 | -13.16% |
| 2025 Q1 | US asphalt shingles | 42,299,957 | -1.67% |
| 2024 Q4 | Canada asphalt shingles | 1,508,891 | +11.19% |
| 2024 Q4 | US modified bitumen | 9,729,549 | +7.41% |
| 2024 Q4 | US built-up roofing sheets | 1,010,641 | -26.09% |
| 2024 Q4 | US asphalt shingles | 37,469,514 | -0.03% |
| 2024 Q3 | Canada asphalt shingles | 2,390,279 | +25.69% |
| 2024 Q3 | US modified bitumen | 11,981,826 | +5.19% |
| 2024 Q3 | US built-up roofing sheets | 1,273,856 | -14.51% |
| 2024 Q3 | US asphalt shingles | 44,895,076 | -1.80% |
| 2024 Q2 | Canada asphalt shingles | 3,057,051 | +27.30% |
| 2024 Q2 | US modified bitumen | 12,786,488 | +5.94% |
| 2024 Q2 | US built-up roofing sheets | 1,413,863 | -21.73% |
| 2024 Q2 | US asphalt shingles | 46,761,344 | -9.58% |
| 2024 Q1 | Canada asphalt shingles | 2,464,363 | -27.32% |
| 2024 Q1 | US modified bitumen | 10,716,549 | +11.23% |
| 2024 Q1 | US built-up roofing sheets | 1,153,523 | -16.24% |
| 2024 Q1 | US asphalt shingles | 43,020,463 | +27.18% |
| 2023 Q4 | Canada asphalt shingles | 1,357,093 | -13.54% |
| 2023 Q4 | US modified bitumen | 9,058,554 | +12.66% |
| 2023 Q4 | US built-up roofing sheets | 1,367,470 | -2.20% |
| 2023 Q4 | US asphalt shingles | 37,481,462 | +25.50% |
| 2023 Q3 | Canada asphalt shingles | 1,901,659 | -38.34% |
| 2023 Q3 | US modified bitumen | 11,390,159 | +18.16% |
| 2023 Q3 | US built-up roofing sheets | 1,490,014 | -18.12% |
| 2023 Q3 | US asphalt shingles | 45,717,847 | +15.93% |
| 2023 Q2 | Canada asphalt shingles | 2,401,531 | -38.52% |
| 2023 Q2 | US modified bitumen | 12,069,719 | +5.34% |
| 2023 Q2 | US built-up roofing sheets | 1,806,472 | -10.56% |
| 2023 Q2 | US asphalt shingles | 51,713,740 | +13.60% |
| 2023 Q1 | Canada asphalt shingles | 3,390,789 | -4.47% |
| 2023 Q1 | US modified bitumen | 9,634,215 | -2.27% |
| 2023 Q1 | US built-up roofing sheets | 1,377,189 | -24.23% |
| 2023 Q1 | US asphalt shingles | 33,827,514 | -21.20% |
| 2022 Q4 | Canada asphalt shingles | 1,569,610 | -46.21% |
| 2022 Q4 | US modified bitumen | 8,040,453 | -9.97% |
| 2022 Q4 | US built-up roofing sheets | 1,398,161 | +3.96% |
| 2022 Q4 | US asphalt shingles | 29,865,538 | -19.31% |
| 2022 Q3 | Canada asphalt shingles | 3,084,236 | -7.42% |
| 2022 Q3 | US modified bitumen | 9,639,903 | -7.62% |
| 2022 Q3 | US built-up roofing sheets | 1,819,677 | +11.27% |
| 2022 Q3 | US asphalt shingles | 39,434,939 | -6.24% |
| 2022 Q2 | Canada asphalt shingles | 3,906,364 | +2.22% |
| 2022 Q2 | US modified bitumen | 11,457,575 | +3.12% |
| 2022 Q2 | US built-up roofing sheets | 2,019,867 | +4.33% |
| 2022 Q2 | US asphalt shingles | 45,521,069 | -2.87% |
| 2022 Q1 | Canada asphalt shingles | 3,549,555 | -14.37% |
| 2022 Q1 | US modified bitumen | 9,858,211 | +5.67% |
| 2022 Q1 | US built-up roofing sheets | 1,817,658 | +8.79% |
| 2022 Q1 | US asphalt shingles | 42,927,935 | -0.73% |
| 2021 Q4 | Canada asphalt shingles | 2,917,763 | +19.09% |
| 2021 Q4 | US modified bitumen | 8,930,779 | -0.28% |
| 2021 Q4 | US built-up roofing sheets | 1,344,956 | -15.80% |
| 2021 Q4 | US asphalt shingles | 37,014,634 | -10.18% |
| 2021 Q3 | Canada asphalt shingles | 3,331,361 | -6.42% |
| 2021 Q3 | US modified bitumen | 10,434,575 | +2.50% |
| 2021 Q3 | US built-up roofing sheets | 1,635,375 | -15.00% |
| 2021 Q3 | US asphalt shingles | 42,061,550 | -10.27% |
| 2021 Q2 | Canada asphalt shingles | 3,821,648 | +20.11% |
| 2021 Q2 | US modified bitumen | 11,111,274 | +40.65% |
| 2021 Q2 | US built-up roofing sheets | 1,936,125 | +7.90% |
| 2021 Q2 | US asphalt shingles | 46,866,575 | +19.39% |
| 2021 Q1 | Canada asphalt shingles | 4,145,053 | +11.46% |
| 2021 Q1 | US modified bitumen | 9,329,119 | +24.23% |
| 2021 Q1 | US built-up roofing sheets | 1,670,799 | -5.23% |
| 2021 Q1 | US asphalt shingles | 43,245,384 | +26.90% |
| 2020 Q4 | Canada asphalt shingles | 2,450,144 | +95.39% |
| 2020 Q4 | US modified bitumen | 8,955,985 | +21.81% |
| 2020 Q4 | US built-up roofing sheets | 1,597,293 | -20.41% |
| 2020 Q4 | US asphalt shingles | 41,209,313 | +44.88% |
| 2020 Q3 | Canada asphalt shingles | 3,559,893 | +12.15% |
| 2020 Q3 | US modified bitumen | 10,179,777 | +6.88% |
| 2020 Q3 | US built-up roofing sheets | 1,924,070 | -10.18% |
| 2020 Q3 | US asphalt shingles | 46,874,478 | +25.12% |
| 2020 Q2 | Canada asphalt shingles | 3,181,783 | -21.42% |
| 2020 Q2 | US modified bitumen | 7,899,925 | -17.84% |
| 2020 Q2 | US built-up roofing sheets | 1,794,395 | -20.85% |
| 2020 Q2 | US asphalt shingles | 39,254,430 | -9.31% |
| 2020 Q1 | Canada asphalt shingles | 3,718,867 | -10.24% |
| 2020 Q1 | US modified bitumen | 7,509,656 | -0.64% |
| 2020 Q1 | US built-up roofing sheets | 1,762,965 | +8.11% |
| 2020 Q1 | US asphalt shingles | 34,078,214 | -8.92% |
| 2019 Q4 | Canada asphalt shingles | 1,253,945 | -3.91% |
| 2019 Q4 | US modified bitumen | 7,352,310 | -5.74% |
| 2019 Q4 | US built-up roofing sheets | 2,006,975 | +16.58% |
| 2019 Q4 | US asphalt shingles | 28,443,053 | -5.07% |
| 2019 Q3 | Canada asphalt shingles | 3,174,116 | -18.02% |
| 2019 Q3 | US modified bitumen | 9,524,329 | +5.71% |
| 2019 Q3 | US built-up roofing sheets | 2,142,232 | +6.75% |
| 2019 Q3 | US asphalt shingles | 37,463,880 | +17.08% |
| 2019 Q2 | Canada asphalt shingles | 4,049,226 | -8.89% |
| 2019 Q2 | US modified bitumen | 9,615,488 | -5.90% |
| 2019 Q2 | US built-up roofing sheets | 2,267,066 | +2.98% |
| 2019 Q2 | US asphalt shingles | 43,284,062 | +4.20% |
| 2019 Q1 | Canada asphalt shingles | 4,143,208 | -12.48% |
| 2019 Q1 | US modified bitumen | 7,557,680 | -9.59% |
| 2019 Q1 | US built-up roofing sheets | 1,630,680 | -19.93% |
| 2019 Q1 | US asphalt shingles | 37,414,443 | -6.35% |
| 2018 Q4 | Canada asphalt shingles | 1,305,005 | No prior year in table |
| 2018 Q4 | US modified bitumen | 7,800,172 | No prior year in table |
| 2018 Q4 | US built-up roofing sheets | 1,721,593 | No prior year in table |
| 2018 Q4 | US asphalt shingles | 29,962,044 | No prior year in table |
| 2018 Q3 | Canada asphalt shingles | 3,871,881 | No prior year in table |
| 2018 Q3 | US modified bitumen | 9,009,722 | No prior year in table |
| 2018 Q3 | US built-up roofing sheets | 2,006,770 | No prior year in table |
| 2018 Q3 | US asphalt shingles | 31,998,593 | No prior year in table |
| 2018 Q2 | Canada asphalt shingles | 4,444,327 | No prior year in table |
| 2018 Q2 | US modified bitumen | 10,217,918 | No prior year in table |
| 2018 Q2 | US built-up roofing sheets | 2,201,358 | No prior year in table |
| 2018 Q2 | US asphalt shingles | 41,541,196 | No prior year in table |
| 2018 Q1 | Canada asphalt shingles | 4,734,237 | No prior year in table |
| 2018 Q1 | US modified bitumen | 8,359,572 | No prior year in table |
| 2018 Q1 | US built-up roofing sheets | 2,036,659 | No prior year in table |
| 2018 Q1 | US asphalt shingles | 39,951,603 | No prior year in table |
No quarters match. Try a year such as 2024 or reset the table.
What do national roof-cost figures actually measure?
Survey spending and insurance claim costs describe different jobs and years; neither is a quote for a particular roof.
| Measure | Figure | Population / period |
|---|---|---|
| Median roofing project | $10,000 | Owner-occupied homes; two years to 2023 |
| Roofing project spending | $93.5 billion | Owner-occupied homes; two years to 2023 |
| Mean replacement cost | $17,631 | Verisk residential insurance data; 2025 |
| Mean repair cost | $4,699 | Verisk residential insurance data; 2025 |
- The 2023 American Housing Survey put median US homeowner roofing-project expenditure at $10,000 for its two-year improvement window, rounded to the nearest $100. (US Census Bureau / HUD, October 2024)
- US homeowners reported 8.3 million roofing projects in the two-year improvement window covered by the 2023 American Housing Survey. (US Census Bureau / HUD, October 2024)
- US homeowner roofing expenditure totalled $93.5 billion in the 2023 American Housing Survey’s two-year improvement window. (US Census Bureau / HUD, October 2024)
- US homeowners spent $827 billion across all home-improvement categories in the 2023 American Housing Survey’s two-year window, providing context for roofing’s share. (US Census Bureau / HUD, October 2024)
- Verisk reported a mean US residential roof-replacement cost of $17,631 in its 2025 insurance-based roof data. (Verisk, May 2026)
- Verisk reported a mean US residential roof-repair cost of $4,699 in its 2025 insurance-based roof data. (Verisk, May 2026)
- Verisk’s mean US residential replacement cost in 2025 was 33% higher than its average for 2021–2024. (Verisk, May 2026)
- Verisk’s US 2025 cost measures rose 1.48% for roofing materials versus 0.79% for roofer labor, rather than moving at one common inflation rate. (Verisk, May 2026)
How is roofing-material demand changing?
Shipments include new construction and reroofing; they count material area, not roofs replaced.
| US shingle shipment measure | Squares | Comparison |
|---|---|---|
| 2025 full year | 154,457,819 | Down 10.3% from 2024 |
| 2026 first half | 82,968,064 | Down 4.7% from first half 2025 |
| 2026 Q2 | 44,838,320 | Up 0.2% from Q2 2025 |
- US asphalt-shingle shipments in the first half of 2026 fell 4.7% from the same period of 2025 in ARMA’s published year-to-date comparison. (ARMA, July 2026)
- US asphalt-shingle shipments for the full year 2025 fell 10.3% from 2024, according to ARMA’s year-end summary. (ARMA, January 2026)
What does the roofer labor market look like?
Employee wages are pay to workers; a contractor’s installed rate also covers other costs.
| Roofer measure | Published value | Period |
|---|---|---|
| Median employee pay | $55,440 / year | May 2025 |
| Jobs including self-employment | 166,900 | 2025 |
| Projected employment growth | 5% | 2025–2035 |
| Annual openings | About 12,000 | Average, 2025–2035 |
- The median annual wage for US roofer employees was $55,440 in May 2025. (Bureau of Labor Statistics, September 2026)
- The lowest-paid tenth of US roofer employees earned below $37,460 annually in May 2025, while the highest-paid tenth earned above $81,720. (Bureau of Labor Statistics, September 2026)
- US roofers held about 166,900 jobs in 2025 in BLS employment estimates that include self-employment. (Bureau of Labor Statistics, September 2026)
- Self-employed workers accounted for 20% of US roofer jobs in 2025. (Bureau of Labor Statistics, September 2026)
- BLS projects US roofer employment to grow 5% between 2025 and 2035. (Bureau of Labor Statistics, September 2026)
- BLS projects about 12,000 US roofer openings per year on average over 2025–2035, including replacement of workers leaving the occupation. (Bureau of Labor Statistics, September 2026)
- BLS says starting roofer-apprentice pay is usually about 50% of journey-worker pay in its US occupational guidance. (Bureau of Labor Statistics, September 2026)
How do roof age, condition and storms affect replacement?
Condition data describe exposure; laboratory improvements describe specific assemblies and test conditions.
| US region | Roofs age 0–4 | Roofs age 31+ |
|---|---|---|
| South | 28% | 4% |
| Midwest | 21% | 17% |
| Northeast | 14% | 18% |
| West | 20% | 11% |
- Verisk’s 2025 aerial-imagery analysis classified 38% of US residential roofs as being in moderate to poor condition. (Verisk, May 2026)
- Verisk’s 2025 baseline associated moderate-to-poor roof condition with approximately 60% higher loss costs than good-to-excellent condition. (Verisk, May 2026)
- Verisk found severe hail affected more than one-fifth of roofs in 16 US states during 2025, compared with twelve states in 2024. (Verisk, May 2026)
- In Verisk’s 2025 analysis, roofs nine years old or younger accounted for 57% of residential properties in its hail states, versus 38% in non-hail states. (Verisk, May 2026)
- IBHS reports that sealing roof-deck seams can reduce water intrusion after roof-cover loss by up to 95% in its testing. (IBHS, accessed October 2026)
- IBHS’s February 2019 disaster-safety strategy reports that re-nailing a roof deck can double its uplift strength, equivalent to 2 times the comparison strength. (IBHS, February 2019)
How large is the roofing industry, and are businesses getting busier?
Census counts US employer businesses in roofing contracting (NAICS 238160), including new work and repairs; firms without payroll are excluded. The separate reroofing survey covers participating US and Canadian contractors and consultants.
| Industry measure | Published figure | Population / period |
|---|---|---|
| Roofing-contractor receipts | $68,783,457,000 | US employer firms; 2022 |
| Employer firms / establishments | 24,044 / 24,532 | US roofing contractors; 2022 |
| Employees | 204,998 | US roofing contractors; mid-March 2022 |
| Annual payroll | $13,301,094,000 | US roofing contractors; 2022 |
| Asphalt-shingle roof coverage | Roughly 80% | ARMA estimate of US roofs; undated |
| Inquiries increased / unchanged / decreased | 37% / 32% / 31% | Reroofing survey; Q2 2026 vs Q2 2025 |
| Contracts increased / unchanged / decreased | 38% / 32% / 30% | Reroofing survey; Q2 2026 vs Q2 2025 |
| Installed volume increased / unchanged / decreased | 35% / 28% / 37% | Contractor survey respondents; Q2 2026 vs Q2 2025 |
- US roofing-contractor employer firms recorded $68,783,457,000 in receipts in 2022, according to Census SUSB data for NAICS 238160. (US Census Bureau, April 2025)
- The US had 24,044 roofing-contractor employer firms in 2022, excluding roofing businesses without payroll. (US Census Bureau, April 2025)
- US roofing-contractor employer firms operated 24,532 establishments in 2022, counting individual business locations rather than companies. (US Census Bureau, April 2025)
- US roofing-contractor employer establishments had 204,998 employees in the mid-March 2022 Census reference period, covering all occupations in those businesses. (US Census Bureau, April 2025)
- US roofing-contractor employer firms paid $13,301,094,000 in annual payroll in 2022, excluding benefits and nonpayroll owner income. (US Census Bureau, April 2025)
- ARMA estimates asphalt shingles cover roughly 80% of US roofs in its undated industry statement, a roof-coverage estimate rather than a share of contractor revenue. (ARMA, accessed October 2026)
- In the US and Canadian coalition reroofing survey for Q2 2026, 37% of respondents reported increased customer inquiries compared with Q2 2025, versus 31% reporting decreases. (National Roofing Contractors Association, July 2026)
- In the US and Canadian coalition reroofing survey for Q2 2026, 38% of respondents reported increased project contracts compared with Q2 2025, versus 30% reporting decreases. (National Roofing Contractors Association, July 2026)
- Among contractors in the US and Canadian coalition reroofing survey for Q2 2026, 35% reported installing more reroofing material, versus 37% installing less, compared with Q2 2025. (National Roofing Contractors Association, July 2026)
What can reflective roofing change?
Compare aged product performance and local climate before treating a reflective surface as an energy-saving upgrade.
| Performance reference | Value | Scope |
|---|---|---|
| Annual air-conditioning energy | Up to 15% reduction | DOE: single-story building, warm or hot climate |
| Sunlight reflected | Up to 90% | DOE: white or specially colored cool roof |
| Cool asphalt shingles | SRI about 20–35 | PNNL: three-year aged |
| White metal finishes | SRI as high as 85–90 | PNNL: three-year aged |
| Home cooling costs | 5–20% reduction | DOE guidance; climate-dependent |
- For single-story buildings in warm or hot climates, US DOE guidance says replacing a conventional roof with a cool roof can reduce annual air-conditioning energy use by up to 15%. (US Department of Energy, August 2021)
- US DOE guidance states that a white or specially colored cool roof can reflect up to 90% of the sunlight that reaches it, reducing solar heat absorption. (US Department of Energy, August 2021)
- PNNL’s residential guidance describes typical three-year-aged cool asphalt-shingle solar reflectance indices of about 20–35, well below the highest white metal finishes at 85–90. (Pacific Northwest National Laboratory, March 2023)
- DOE’s August 2021 consumer guide says a cool-color roof can reduce home cooling costs by 5–20%, with savings varying by climate and greatest in hot and warm areas. (US Department of Energy, August 2021)
How much roofing waste is generated, and where does it go?
Waste generation, disposal and stockpiles describe different flows and years; stockpiles are not a recycling rate.
| Measure | Quantity | Scope / year |
|---|---|---|
| Asphalt-shingle debris generated | 15.1 million US tons | EPA estimate; 2018 |
| All construction and demolition debris | 600.3 million US tons | EPA estimate; 2018 |
| Reclaimed shingle stockpiles | 1.44 million tons | NAPA estimate; end of 2024 |
| Asphalt-shingle landfill / next-use destinations | 13.0 / 2.1 million US tons | EPA estimates; 2018 |
- EPA estimated US asphalt-shingle construction and demolition debris generation at 15.1 million US tons in 2018. (US Environmental Protection Agency, December 2020)
- EPA estimated total US construction and demolition debris at 600.3 million US tons in 2018, including buildings, roads and other construction rather than roofs alone. (US Environmental Protection Agency, December 2020)
- NAPA estimated reclaimed asphalt-shingle stockpiles at 1.44 million tons nationwide at the end of the 2024 paving season, up 22.5% from 2023. (National Asphalt Pavement Association, May 2026)
- EPA estimated 13.0 million US tons of asphalt-shingle debris went to landfill in 2018, versus 2.1 million tons directed to next-use destinations. (US Environmental Protection Agency, December 2020)
For your own measured roof, use the replacement cost estimator, the roof area calculator or the roof pitch calculator. See the replacement process to turn the figures into a scope of work.
Cite this page
Roof Replacement Cost Estimator. 40 roofing statistics for 2026. Updated October 24, 2026. https://roofreplacementcostestimator.com/roof-replacement-process/roofing-statistics/
Methods
We checked 56 candidate findings and kept 40 with an identifiable primary publisher and a clear population, unit and period. Repeated values by year, product or region stay in tables. Access dates identify undated sources.
The shipment table covers four ARMA series; later published revisions are used where available. Census receipts cover employer roofing contractors, including new work and repairs; they are not a replacement-only market valuation. Survey medians, insurance-claim means, wages and shipment quantities retain their separate populations and periods.
Figures rechecked October 24, 2026. Next review: January 24, 2027, or sooner when ARMA releases another quarter or a cited publisher corrects its records. Send a correction through our contact page; include the figure and its original source.
Primary sources
- US Census Bureau / HUD · October 2024
- Verisk · May 2026
- ARMA · July 2026
- ARMA · January 2026
- Bureau of Labor Statistics · September 2026
- Pacific Northwest National Laboratory · March 2023
- National Asphalt Pavement Association · May 2026
- US Environmental Protection Agency · December 2020
- National Roofing Contractors Association · July 2026
- US Department of Energy · August 2021
- US Census Bureau · April 2025
- ARMA · accessed October 2026
- IBHS · accessed October 2026
- IBHS · February 2019